from John Dee’s Almanac facebook site
The false positive reporting rate lies at the heart of much analysis that I’m churning out at present so I thought it timely to run folk through a basic refresher so they can calculate this rate for themselves using nothing more than pencil and paper. In understanding how this comes about you’ll know more than most, especially those ‘experts’ you’ll be finding among your friends, family and colleagues.
The diagnostic performance of all medical tests, including PCR, is characterised by two estimates, these being test sensitivity and test specificity. Incredibly nobody knows precisely what these are for PCR but authorities have made a guess that sensitivity is 80% and specificity is 99.9%. We shall now consider what these mean.
A test sensitivity of 80% means 80 out of every 100 people who are infected with COVID will be declared positive using PCR. These are what we call true positives because they have been told they are positive when they really are infected. The remaining 20 people, despite being infected, will be erroneously told they are negative and so we call these false negatives.
A test specificity of 99.9% means 999 out of every 1,000 people who are not infected with COVID will be declared negative using PCR. These are what we call true negatives because they have been told they are negative when they are uninfected. The remaining 1 person, despite also being uninfected, will be erroneously told they are positive and so we call these false positives.
Before we can apply these rates in a meaningful manner we need to know something called pre-test probability. This tells us how likely it is that somebody is infected as they turn up for a test. A pre-test probability of 10% means there is a 1 in 10 chance that they are carrying the disease.
The risk of contracting a disease depends on many factors such as where a person lives, where they work, what their job is, how they socialise etc and is thus a highly individual thing. For a hermit living in cave this probability drops to zero, for a frontline nurse on a COVID ward going to raves every night with colleagues this probability rockets.
Since it is impossible to determine individual risk what we have to do is consider the population as a whole. If 1 out of every 100 people in a region are testing positive with symptoms then it is reasonable to assume the pre-test probability for others living in the same region is also down at 1% i.e. they all have a 1% pre-test probability of carrying the disease. Thus, the general rate of infection (a.k.a disease prevalence) becomes the figure we use for pre-test probability.
Let us now get our pencil and paper and, for simplicity’s sake, we shall try some calculations using 10% for pre-test probability, 80% for test sensitivity and 90% for test specificity.
We shall assume 1,000 people go for a test…
- The first figure we need to determine is how many of those 1,000 are likely to be infected and the calculation for this is 10% x 1,000 = 100. The number of likely uninfected people is thus 1,000 – 100 = 900.
- We now know there are 100 infected people. With a test performing at 80% sensitivity we are going to declare 80% x 100 = 80 of these as positive (true positives), thus leaving 20 infected people who were erroneously told they were negative (false negative).
- We also know there are 900 uninfected people. With a test performing at 90% specificity we are going to declare 90% x 900 = 810 of these as negative (true negatives), thus leaving 90 uninfected people who were erroneously told they were positive (false positive).
Our 1,000 people have generated 80 true positives, 20 false negatives, 810 true negatives and 90 false positives. The total positive count is 80 + 90 = 170, whilst the total negative count is 810 + 20 = 830. We may now calculate four different rates: true positive rate, false positive rate, true negative rate and false negative rate:
- True positive rate = 100 x (80 / 170) = 47.1%
- False positive rate = 100 x (90 / 170) = 52.9%
- True negative rate = 100 x (810 / 830) = 97.6%
- False negative rate = 100 x (20 / 830) = 2.4%
I am hoping people have managed to reproduce these numbers and understand the very simple logic behind them. This logic is inescapable, for once you settle on a value for pre-test probability, test sensitivity and test specificity only one solution presents itself. The real issue is thus one of determining these initial starting values.
Those who’ve managed to follow the above example might like to try the same calculations again but with the ‘official’ 99.9% test specificity; my spreadsheet yields a false positive rate of 100 x (1 / 81) = 1.1%.
You might also like to try a 1% pre-test probability with 99.9% specificity; my spreadsheet now yields a false positive rate of 100 x (1 / 9) = 11.0%. So what about these official claims of the false positive rate being minuscule? Well, with test specificity stuck at the ‘official’ 99.9% you can only get down to a false positive report rate of 1% or lower if disease prevalence (pre-test probability) is up at 11% and beyond – try it out!
Thus, we see that these claims only hold true for substantial levels of disease. Since the latest official estimate for disease prevalence in England is down at 0.1% (REACT) then the official narrative simply doesn’t hold up – you can’t have 99.9% specificity, 0.1% prevalence *and* 1% false positive reporting, at least not in a universe where logic applies.
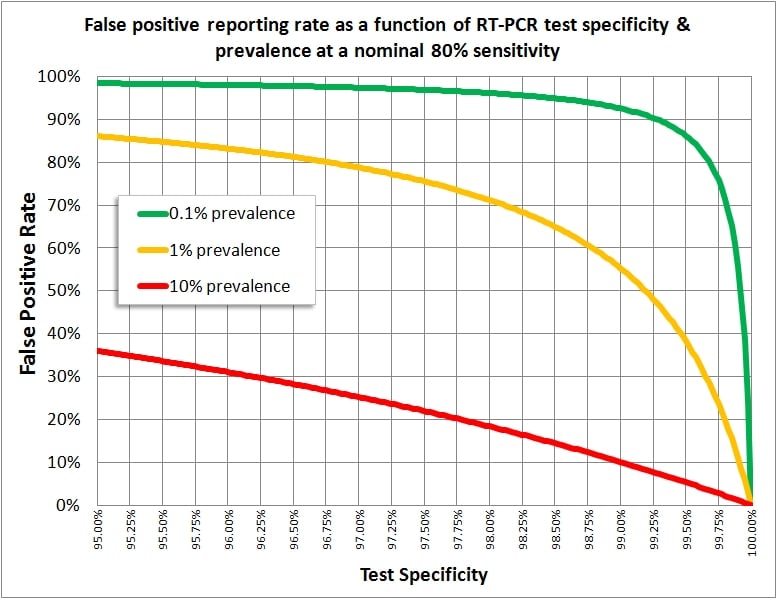
What is unbelievable is the sheer number of experts (professional or home-spun) who don’t understand the basic maths. I am hoping group members are now fully armed and I attach a graph showing how pre-test probability (disease prevalence), test sensitivity and test specificity interact to produce varying rates for false positives.
